You can view analytics about scores and responses as well as question and distractor quality on any assessment that uses Crowdmark’s multiple choice bubble sheet. After booklets have been matched to students and the assessment has been graded you can view the analytics by navigating to the Results page of your assessment and clicking the Multiple choice analytics button.
Scores
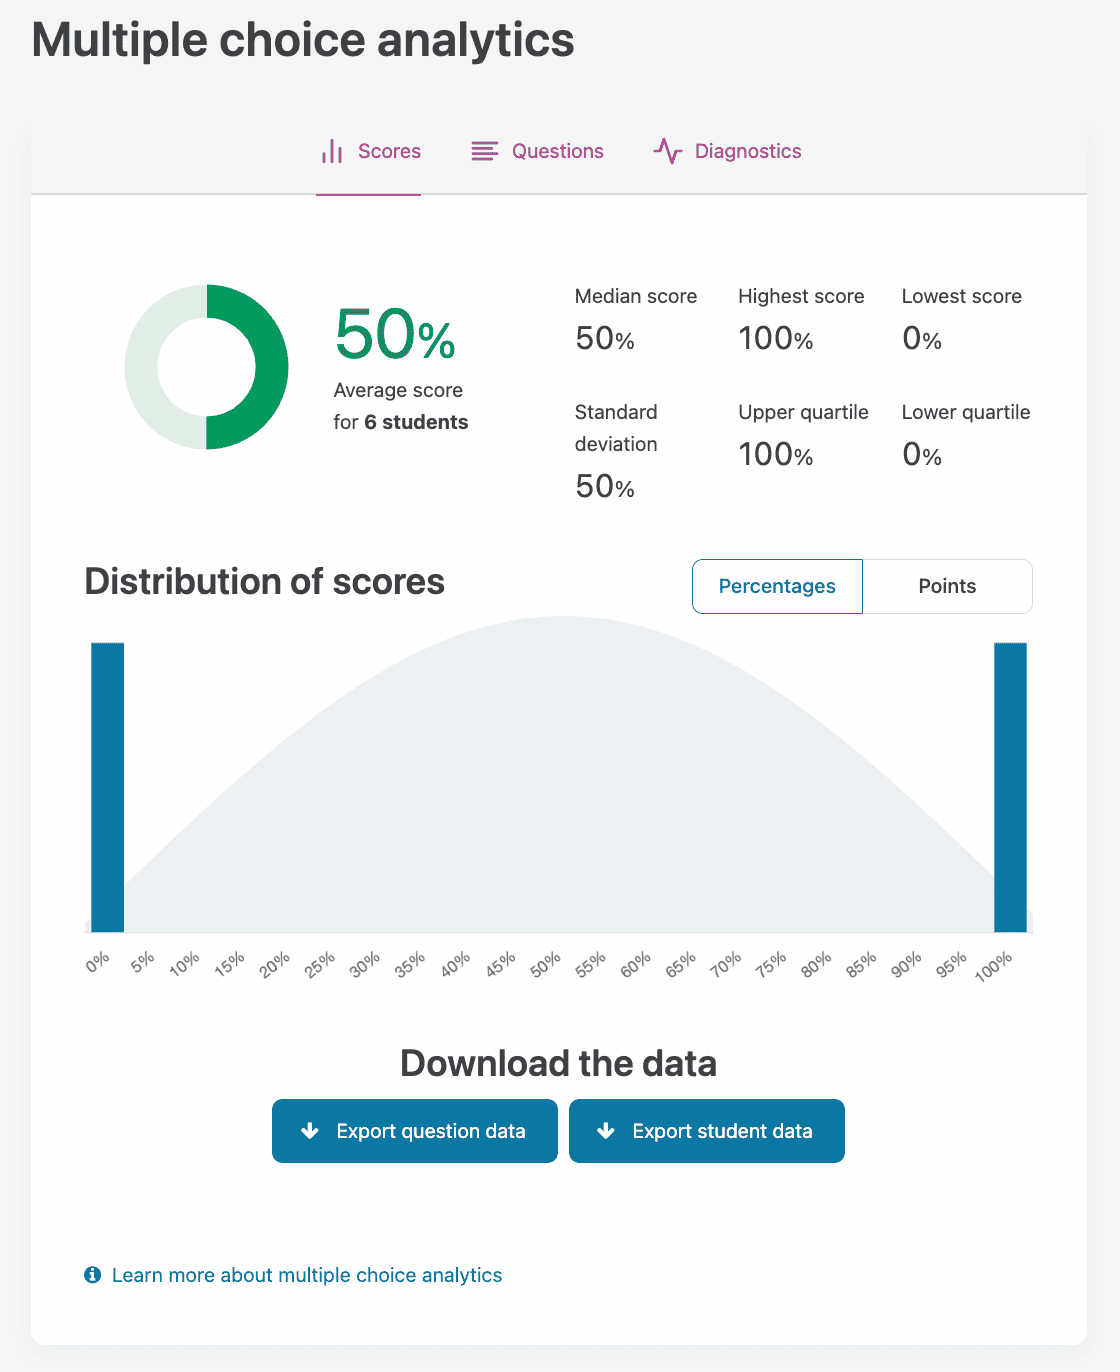
The Scores page displays statistics for the total scores on the multiple choice component of your assessment. You can also download the data as CSV files to analyze question and student responses.
- Number of students: The total number of students matched to a graded assessment.
- Average score: Mean total score
- Median score: Middle score when the total scores are sorted from lowest to highest
- Lower quartile: Middle score of the lower half of scores when sorted from lowest to highest
- Upper quartile: Middle score of the upper half of scores when sorted from lowest to highest
- Highest score: Highest total score
- Lowest score: Lowest total score
- Standard deviation: Measures the amount of variation in the total scores
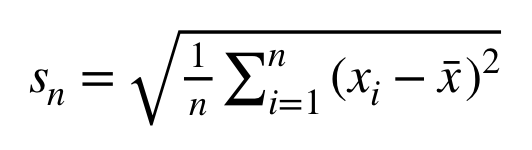
where
nis the number of students,xiis the total score for studentiandxis the average total score on the test
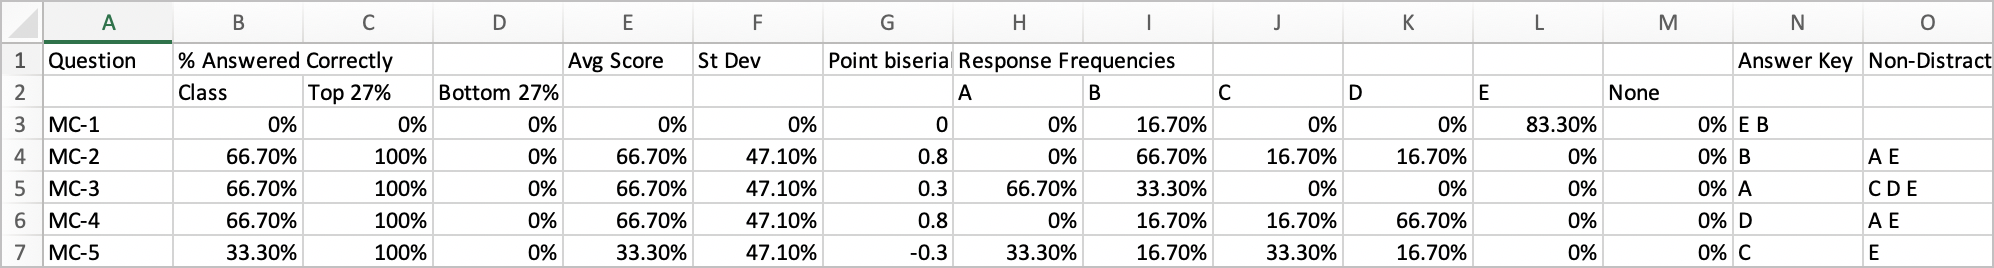
Question data export
From the Scores page, you can download a CSV file of data for each question. The following statistics are available in the export:
- Percent answered correctly: Percent of students who answered the question correctly
- Class: Percent of all students who answered the question correctly
- Top 27%: Percent of students who answered the question correctly in the top 27% of scores when total scores are sorted from lowest to highest
- Bottom 27%: Percent of students who answered the question correctly in the bottom 27% of scores when total scores are sorted from lowest to highest
- Average Score: Mean score on question
- Standard Deviation: Measures the amount of variation in the question score
- Point biserial: Measures how well the question discriminates between high and low scoring students. Point biserial less than 0.2 should be rejected or improved by revision
- Response Frequencies: Percent of students who selected each response (A, B, C, D, E, or x for no response)
- Answer Key: Correct response or responses to question
- Non-Distractors: Response(s) to question not selected by any students.
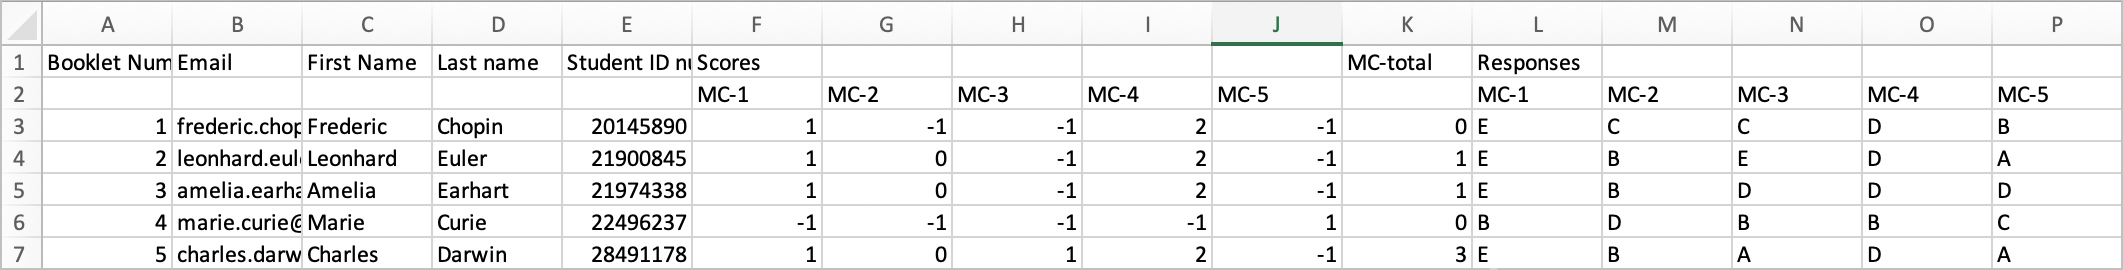
Student data export
From the Scores page, you can download a CSV file of data for each student. The following statistics are available in the export:
- Scores: Score on each multiple choice question
- Total Score: Total score on all multiple choice questions. Total score has a minimum value of 0. If the sum of the scores produces a negative value, Crowdmark will record it as 0.
- Responses: Selected response for each question (A,B,C,D,E, or x for no response)
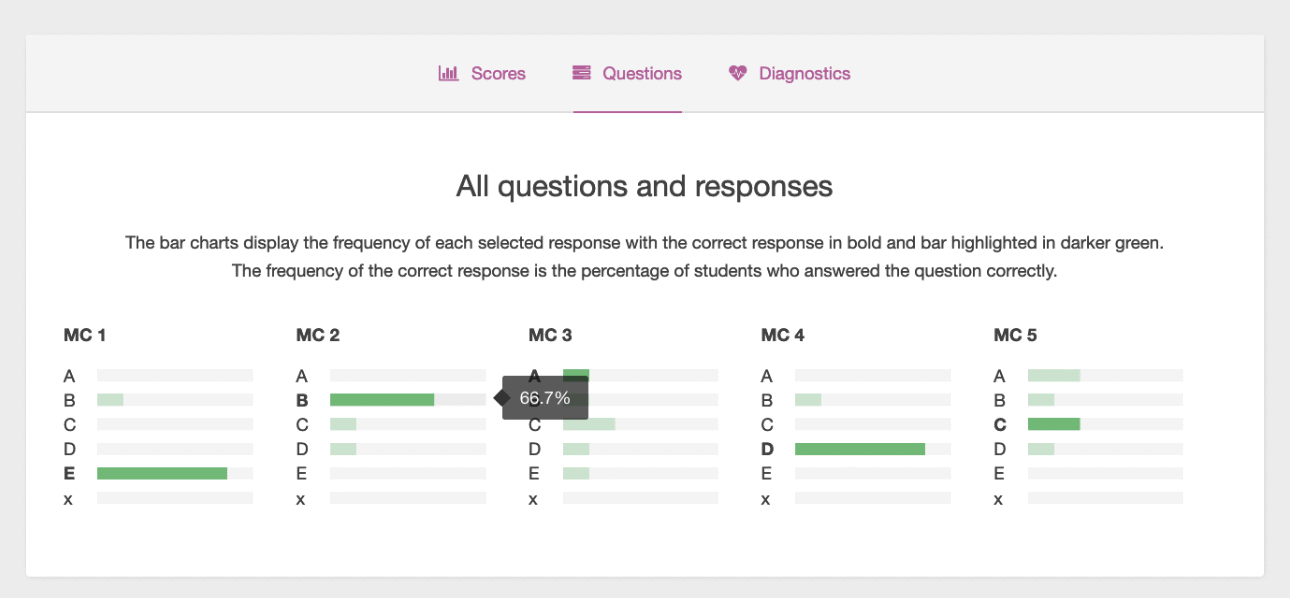
Questions
For each multiple choice question on your test, Crowdmark displays a bar chart showing the frequencies of each response and of no response selected (denoted “x”) on the Questions page. Hovering over one of the green bars will show you the percentage of students who selected this response. The correct response for the question is typed in bold and the corresponding bar is highlighted in darker green.
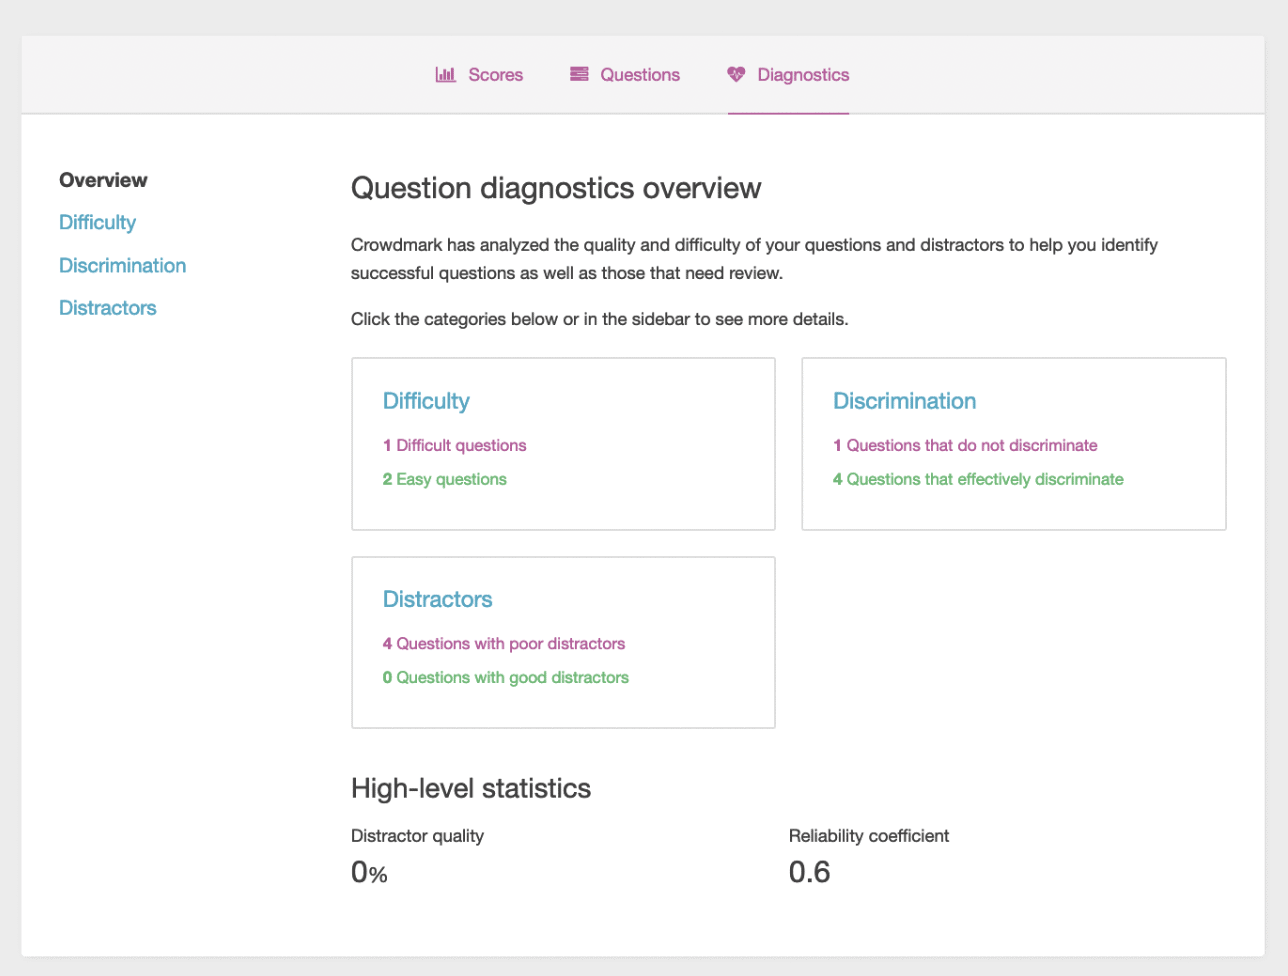
Diagnostics
The Diagnostics page summarizes your multiple choice questions in terms of difficulty, discrimination and distractors. Often referred to as item analysis, these diagnostics give you insight into your individual multiple choice questions as well as some test-level statistics to help you determine the quality of your test. Crowdmark highlights your most difficult and easiest questions, questions that are most and least effective at discriminating between your best and worst performing students and questions that include functional and nonfunctional distractors.
-
Difficulty: The difficulty of a question is determined by computing the percentage of students who answered the question correctly.
Crowdmark classifies questions as easy when more than 70% of students answer correctly and difficult when less than 30% of students answer correctly.
-
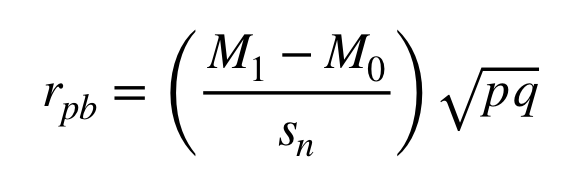
Discrimination: The discrimination of a question refers to the correlation between student responses to a particular question and total scores on the test. Crowdmark uses the Point Biserial coefficient, denoted by
rpb, to calculate the discrimination of the correct response to each question using the formula:
where
M1is the mean test score for the group who answered the question correctly,M0is the mean test score for the group who answered the question incorrectly,snis the test standard deviation,pis the proportion of students who answered the question correctly andqis the proportion of students who answered the question incorrectly.A positive point biserial coefficient for a correct response indicates that those who scored well on the whole test answered the question correctly. Generally, the correct response for a point biserial greater than 0.40 is a very good discriminator and less than 0.2 should be rejected or improved by revision.
Point biserial correlation coefficients can also be calculated for each incorrect response (distractor). A question should have a negative point-biserial discrimination for each of its distractors. This means that the incorrect responses were selected by the weaker students.
-
Distractors: Distractors are the incorrect responses to a question.
Crowdmark classifies questions as poor distractors poor when an incorrect response to the question was selected by less than 5% of students or the incorrect response was selected by top performing students.
Crowdmark classifies questions as having good distractors when all incorrect responses are chosen by at least 5% of the students and incorrect responses are selected by weak students.
High-level statistics
-
Distractor quality: Distractors are the incorrect responses to a question. For example, if the correct response to a question is B, then the distractors would be A, C, D and E. A good distractor is one that was selected by students with low achievement. Crowdmark measures the distractor quality of the overall test by calculating the percentage of good distractors on the test. Crowdmark classifies a good distractor as having a frequency of response of at least 5% and discriminating towards students with a lower total score. Crowdmark uses the point biserial coefficient to calculate the discrimination correlation of each distractor.
-
Reliability coefficient: Measures whether the test as a whole discriminates between higher and lower performing students. Crowdmark uses the Kuder-Richardson 20 coefficient (KR-20) to calculate the test reliability, which we will denote by
rin the formula below.
where K is the number of questions,
piis the proportion of students who answered questionicorrectly,qiis the proportion of students who answered questioniincorrectly andsnis the test standard deviation.The KR-20 coefficient typically ranges between 0 and 1 but it is possible to obtain a negative value with small sample sizes. The closer to 1 the more reliable an exam is considered because its questions do a good job consistently discriminating among higher and lower performing students.
The interpretation of the KR-20 depends on the purpose of the test. Tests intended to distinguish between students who have mastered the material and those who have not should have a reliability coefficient of 0.5 or higher. A test with a KR-20 value less than 0.3 is considered poor. If the purpose of the test is to ensure that all students have mastered essential concepts, then the KR-20 value should be close to 0.

Sources:
- Distractor Efficiency in an Item Pool for a Statistics Classroom Exam: Assessing Its Relation With Item Cognitive Level Classified According to Bloom’s Taxonomy
- Kuder–Richardson Formula 20 on Wikipedia
- Interpreting Exam Performance: What Do Those Stats Mean Anyway?
- Statistical Analysis of Multiple Choice Exams
- Item Analysis for Criterion-Referenced Tests